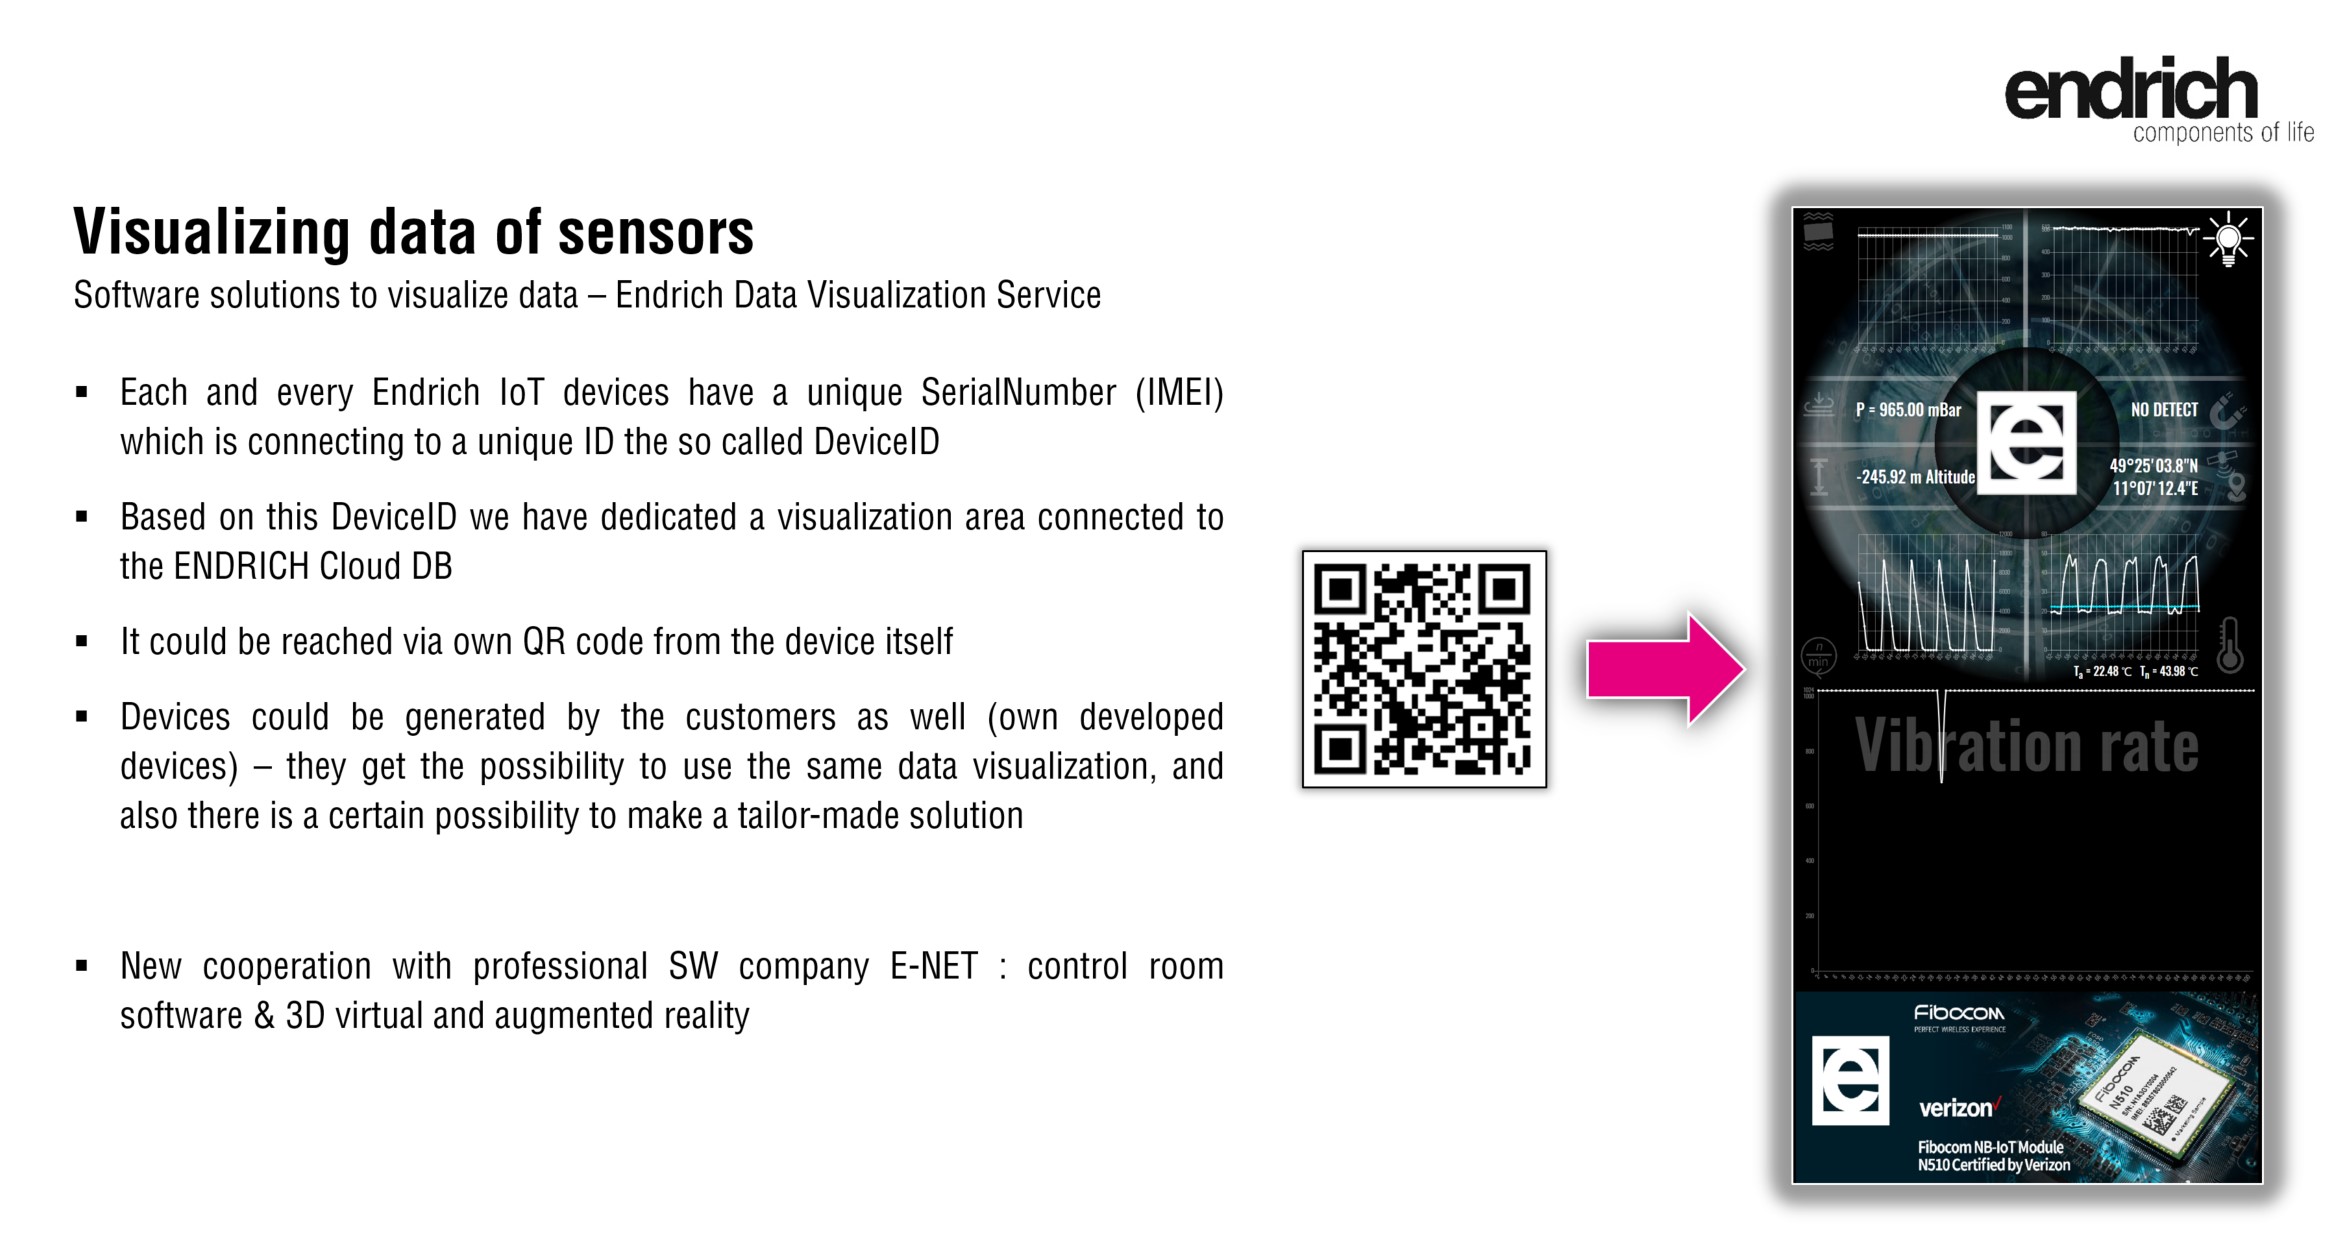
8 ENDRICH DATA VISUALIZATION GATEWAY
A WEB based visualization service is available for each users of the Endrich Cloud Database Service. Each of the devices (identified by either deviceID or IMEI number) may access a special service offering visualization of their sensors’ data individually. This means for every device, there will be an own visual interface available.
8.1 Endrich Visual Interface Service Setup
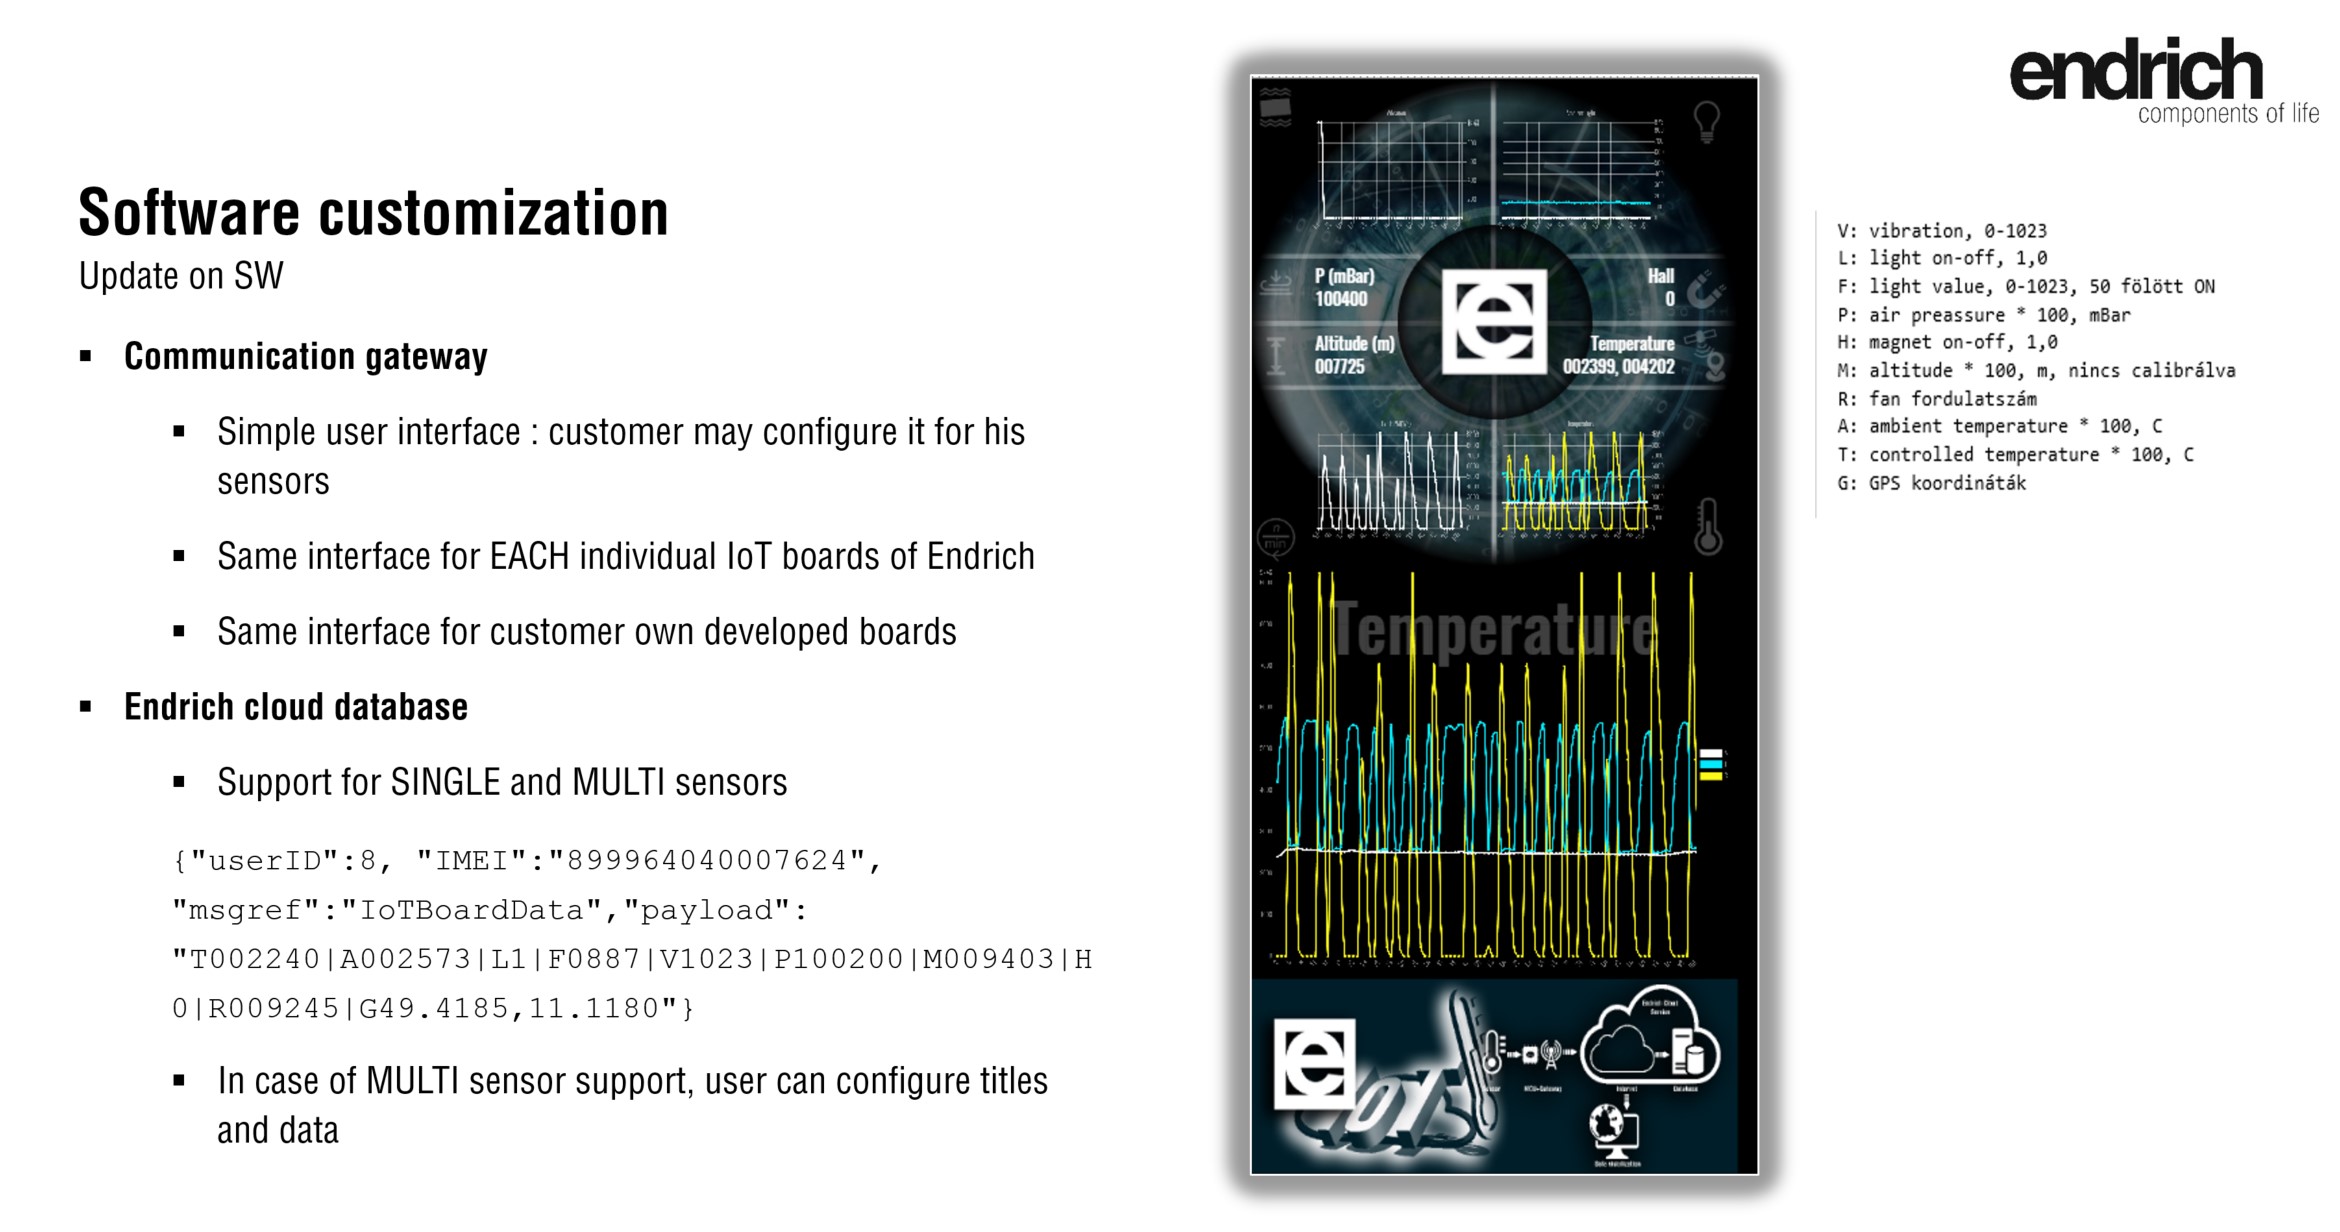
A Web based visualization gateway is also provided for every endpoint sending multiple sensor data to the Endrich Cloud Database. We have defined a specific payload format for such messages. The sensor readings can be sent in a single message with a pipe | separator character, the first character is a field prefix, and it is followed by the data itself.
Multi-sensor payload format:

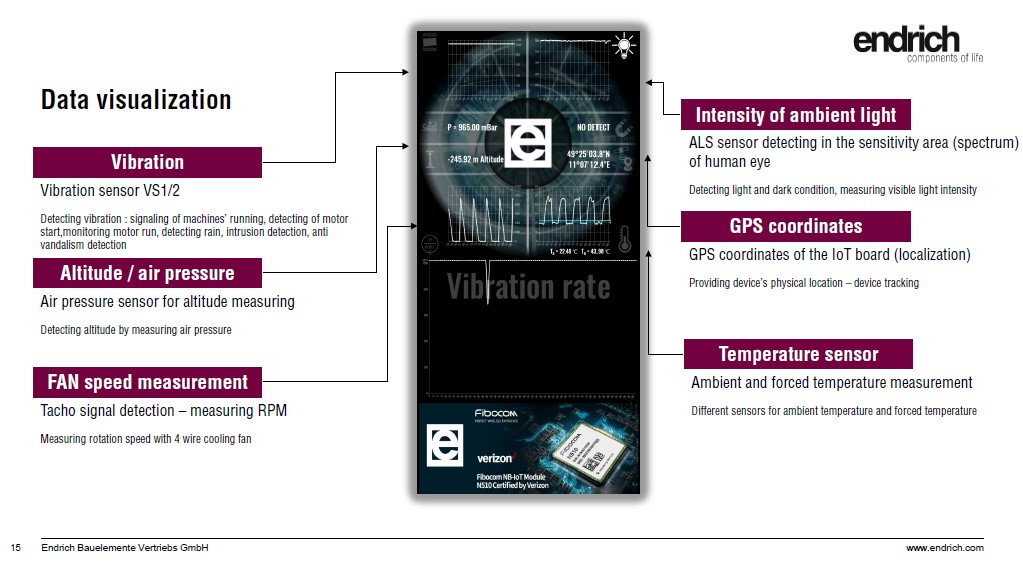
An advanced visual data representation or Visual Gateway is provided to display such data. It shows four data charts displaying a latest 50 readings, and four value display lines to display the last (or current) value.
This data format and the Visual Gateway have been first used on Embedded World 2020: http://31.46.42.254:82/iot-demo/
With payload format:

(Single line!)
The Visual Gateway has been extended to be customizable, thus our developer partners may show their own data and own captions in every fields. The layout is fixed, the fields can be defined by each user using the Device Type definition screen.
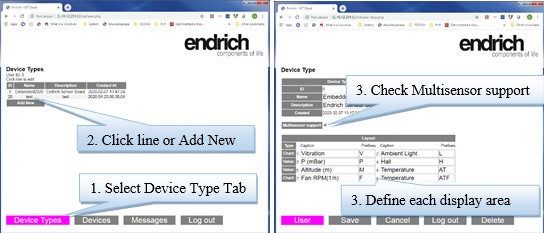
The display areas are numbered, each chart and value caption and the prefix of the displayed data can be set.
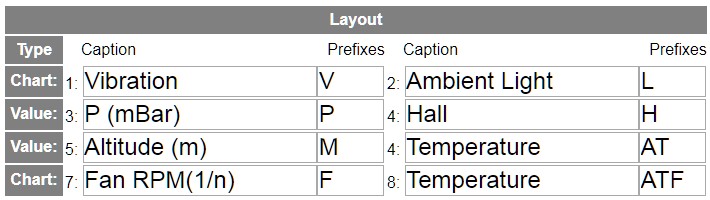
Caption defines the title text,
Prefixes (max 5) define the data to display. Default data range is 0 to 1 and extending automatically when an out of range value have been added. X labels are ordinal numbers. The same range is used to display multiple data sets (see Chart 8)
Values:
First line displays Caption, second line the requested data fields. Comma separated when multiple prefixes are defined (see Value 6)
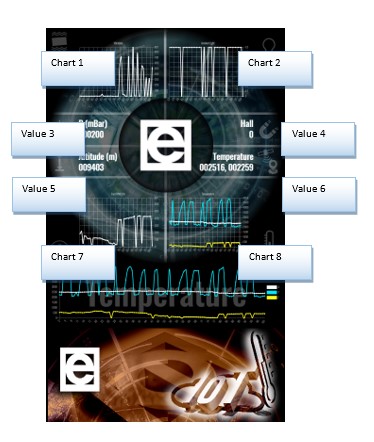
The content of the full width chart - below the matrix - rotates the four charts. When the device type have been set up and used in any number of devices, the data sent from such a device can be displayed using the Gateway URL, which contains the User ID and the Device ID or the IMEI number as it is displayed on the Devices screen:
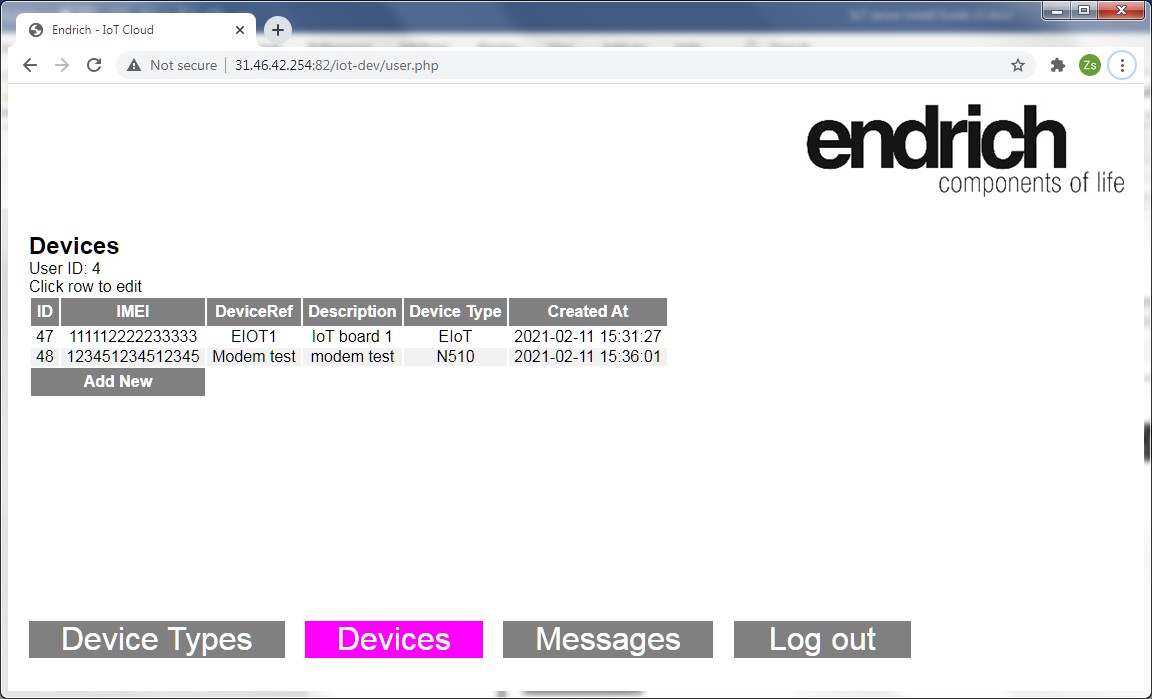
The URL of the extended visual gateway contains the userID and a deviceID, or the IMEI number:
http://31.46.42.254:82/iot-demo/ms.php?UID=8&DEVS=11
http://31.46.42.254:82/iot-demo/ms.php?IMEI=111112222233333
Please use your own User ID and Device ID in case of testing this service. If there is no parameter given, the gateway asks for an IMEI number. It can be read from the modem. The entered value is trimmed to 15 characters.
8.2 Endrich Visualization Gateway properties
The operation of the whole E-IoT Ecosystem can be seen on below image:
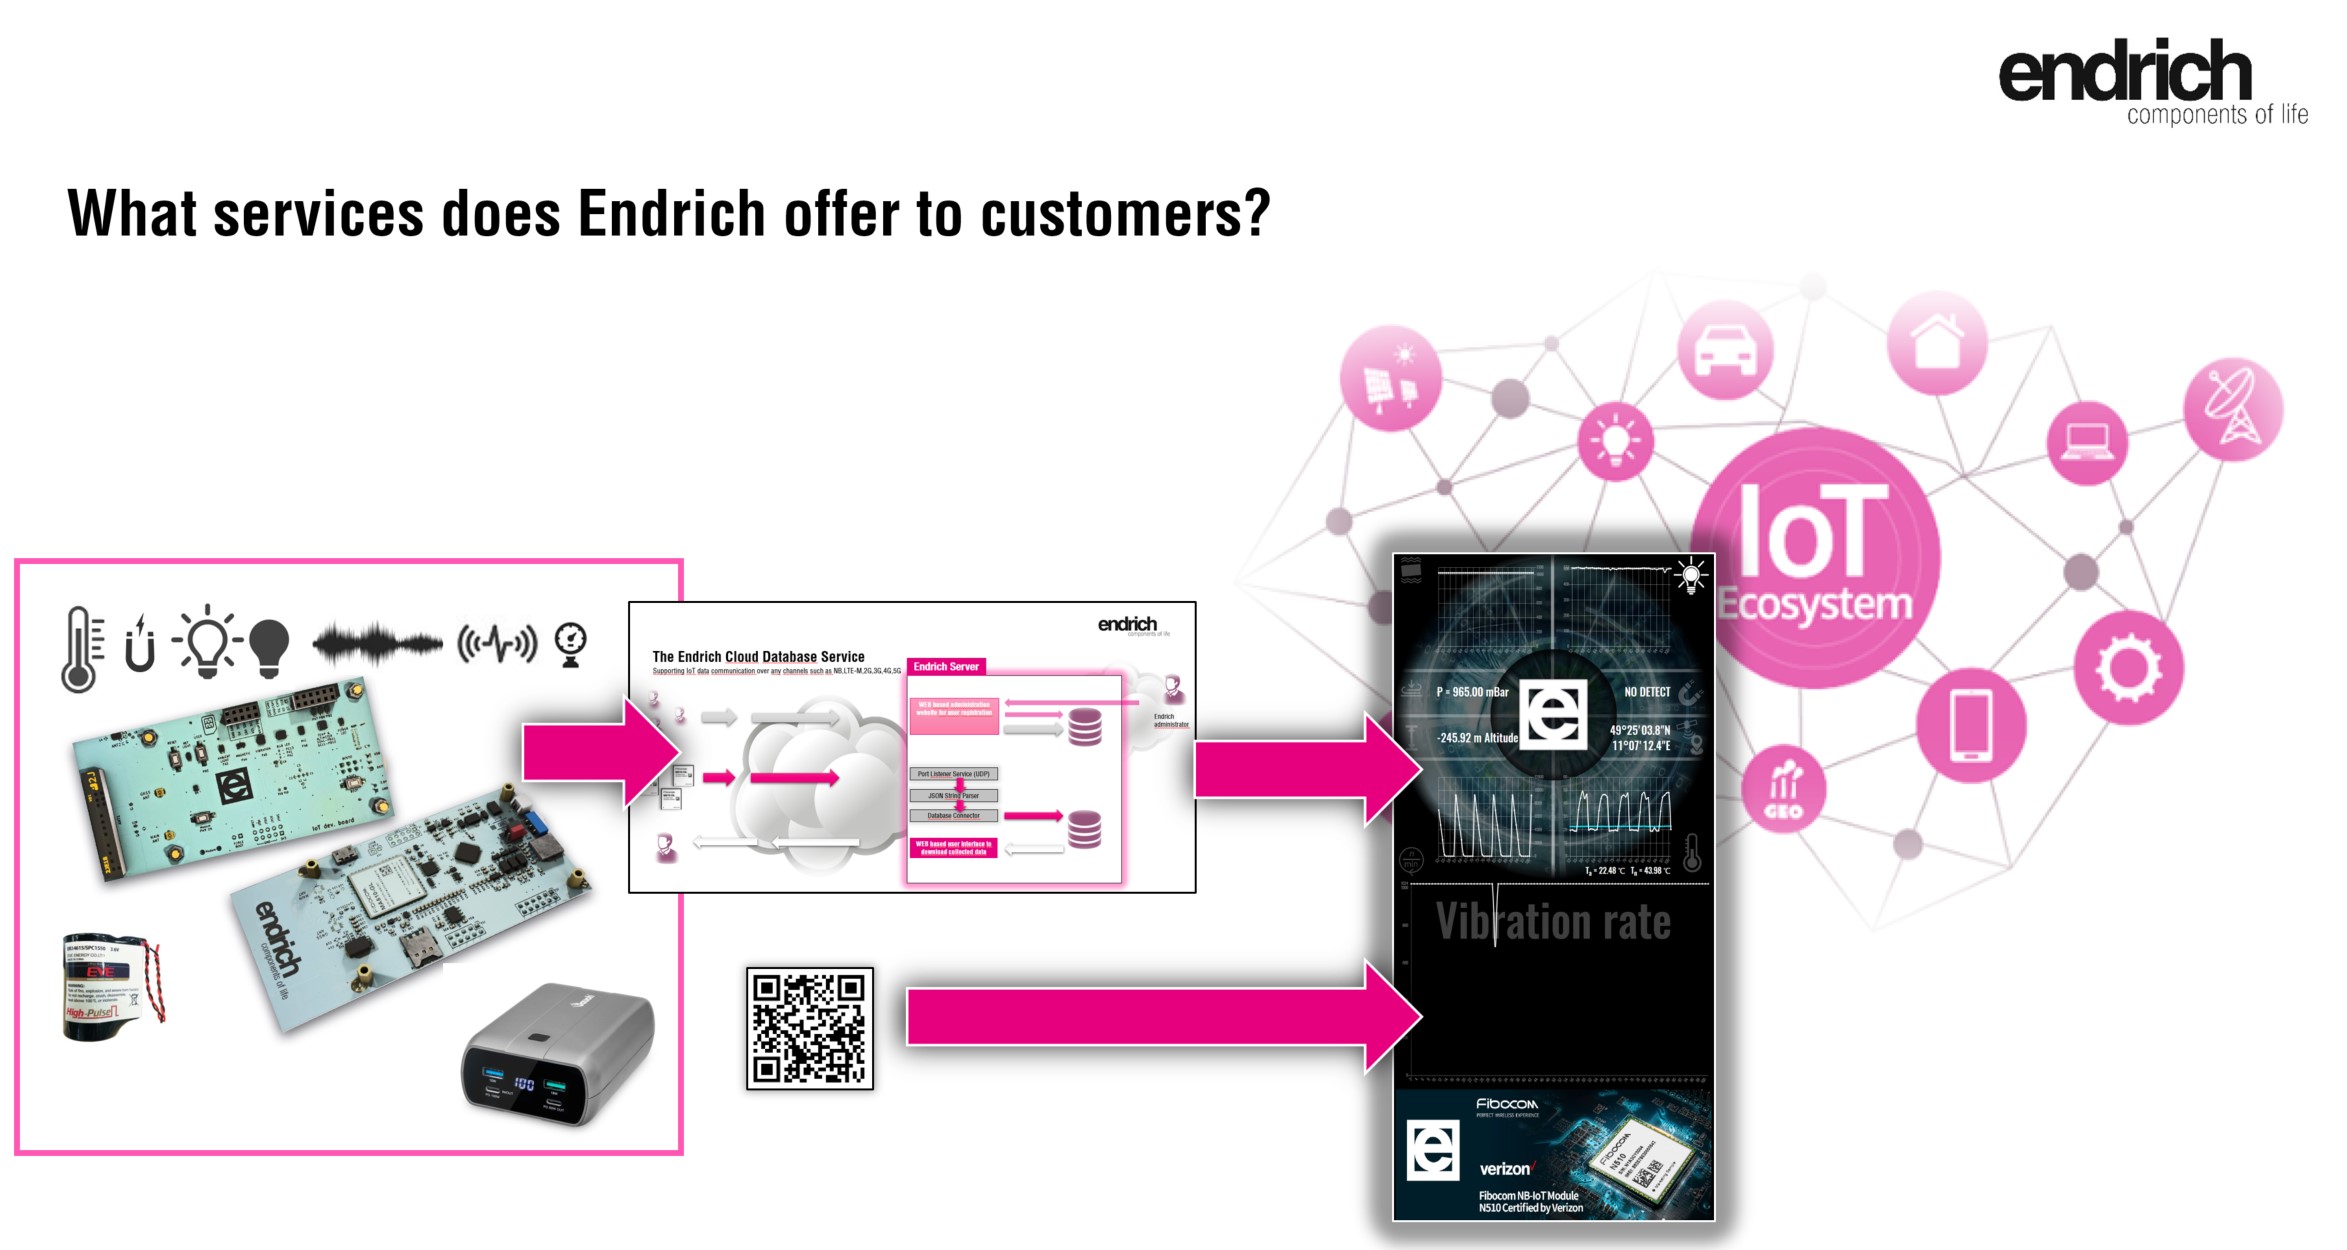
Users’ devices deliver sensors’ data which are stored in the Endrich Cloud Database and could be visualized by this Visualization Service.
8.3 3rd party services provided by external Software Houses (E-NET)
As Endrich Visualization Gateway Service only provides basic data visualization, we have the possibility to offer tailor made data mining, data evaluation and visualization packages upon individual agreements. These can be 3 dimensional augmented or virtual reality type of visualization based on unityEngine technology :
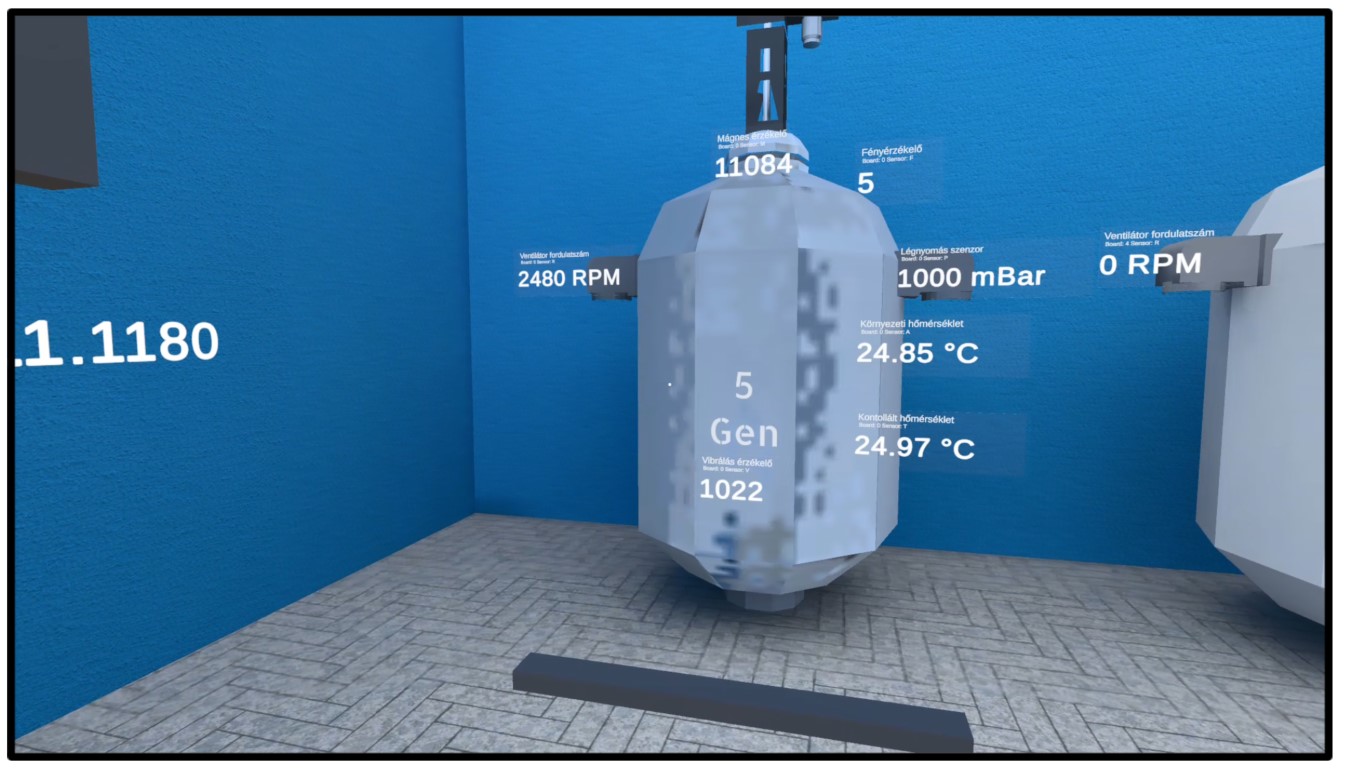
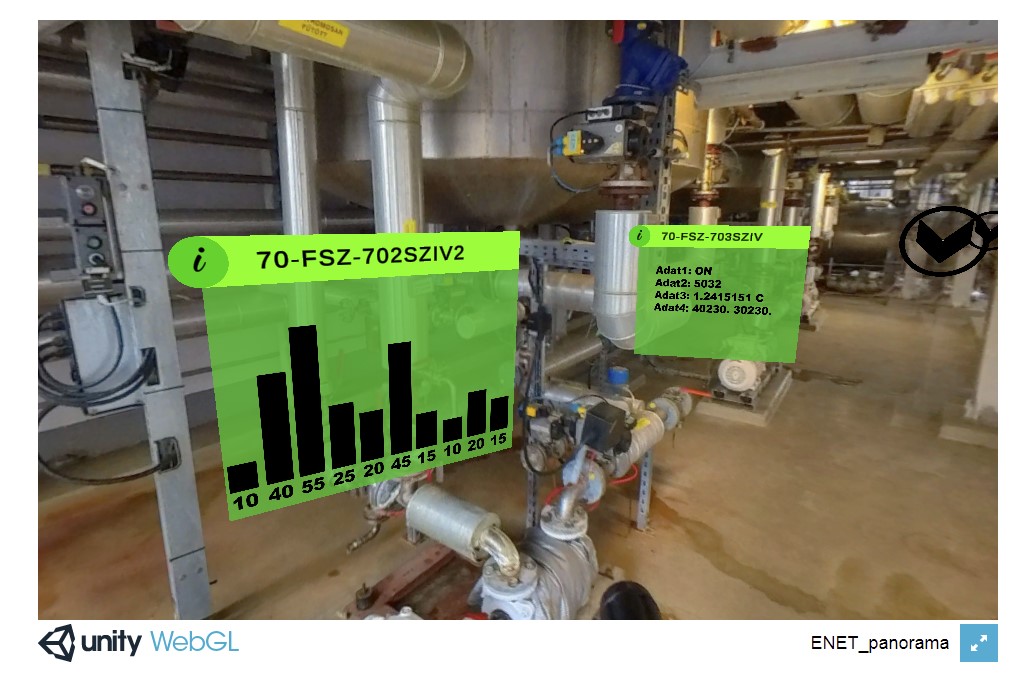
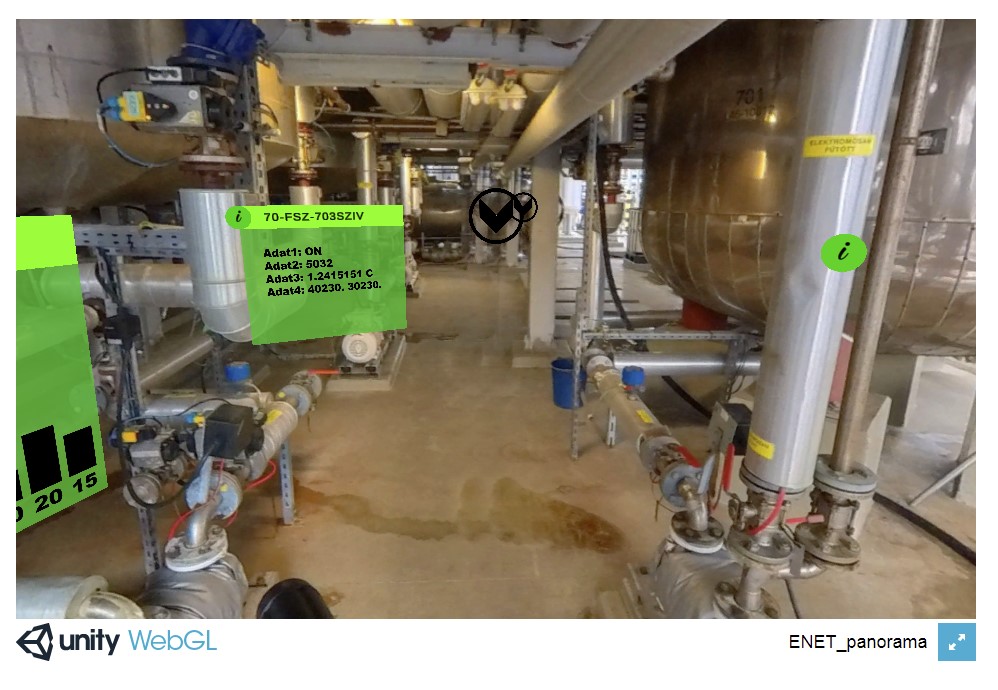
Other popular data visualization is possible to use augmented reality technology. In this case the real-time sensor readings can be accessed in the augmented reality looing around the “virtual machine room”.
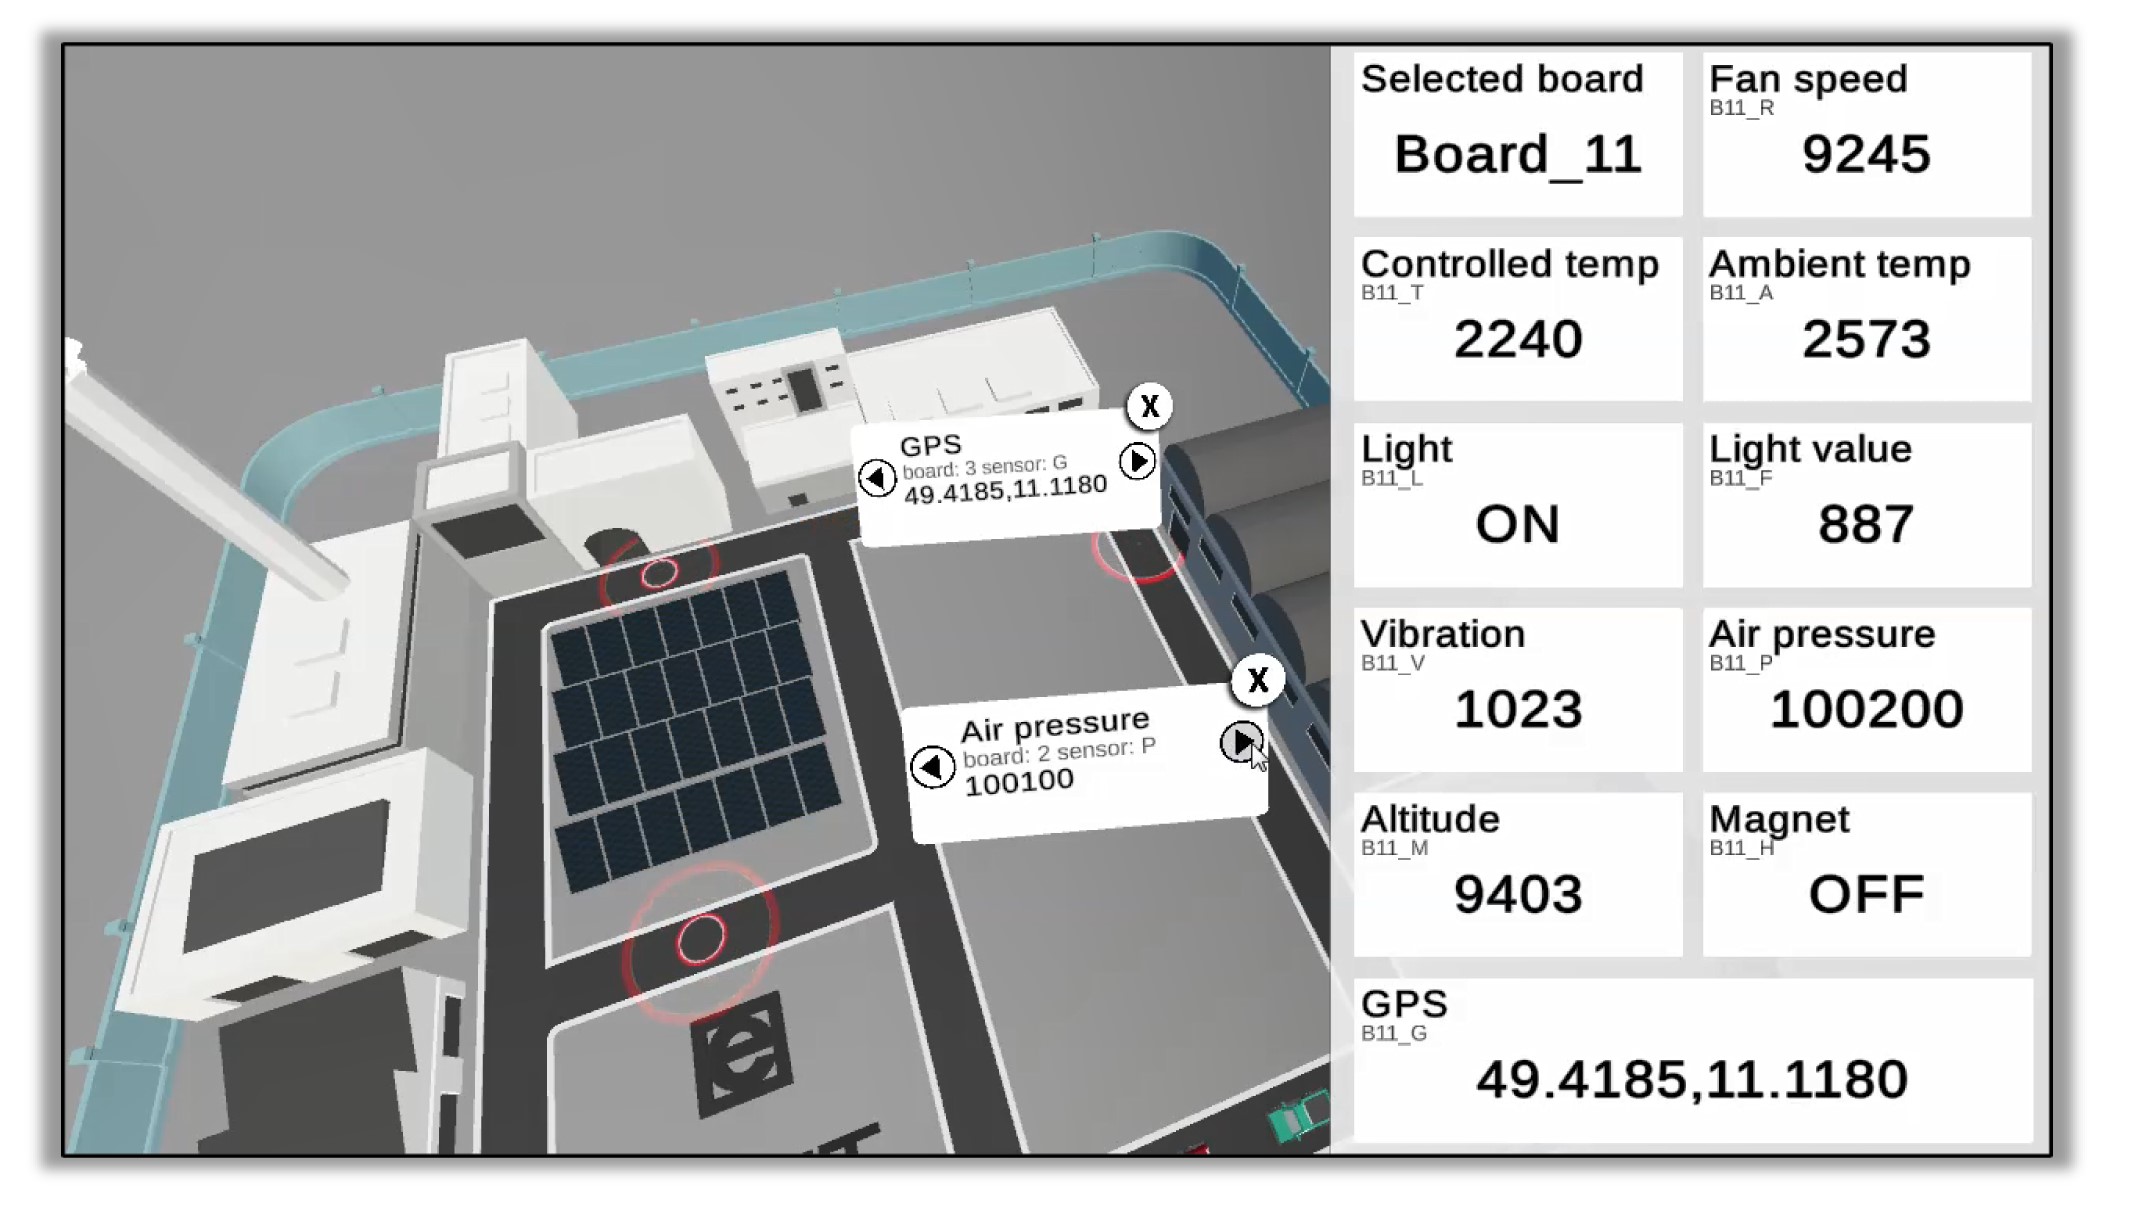
One can imagine having a factory yard with solar cells, modeled in 3D virtualization, and all live sensor data is accessible on a virtual tour around the area:
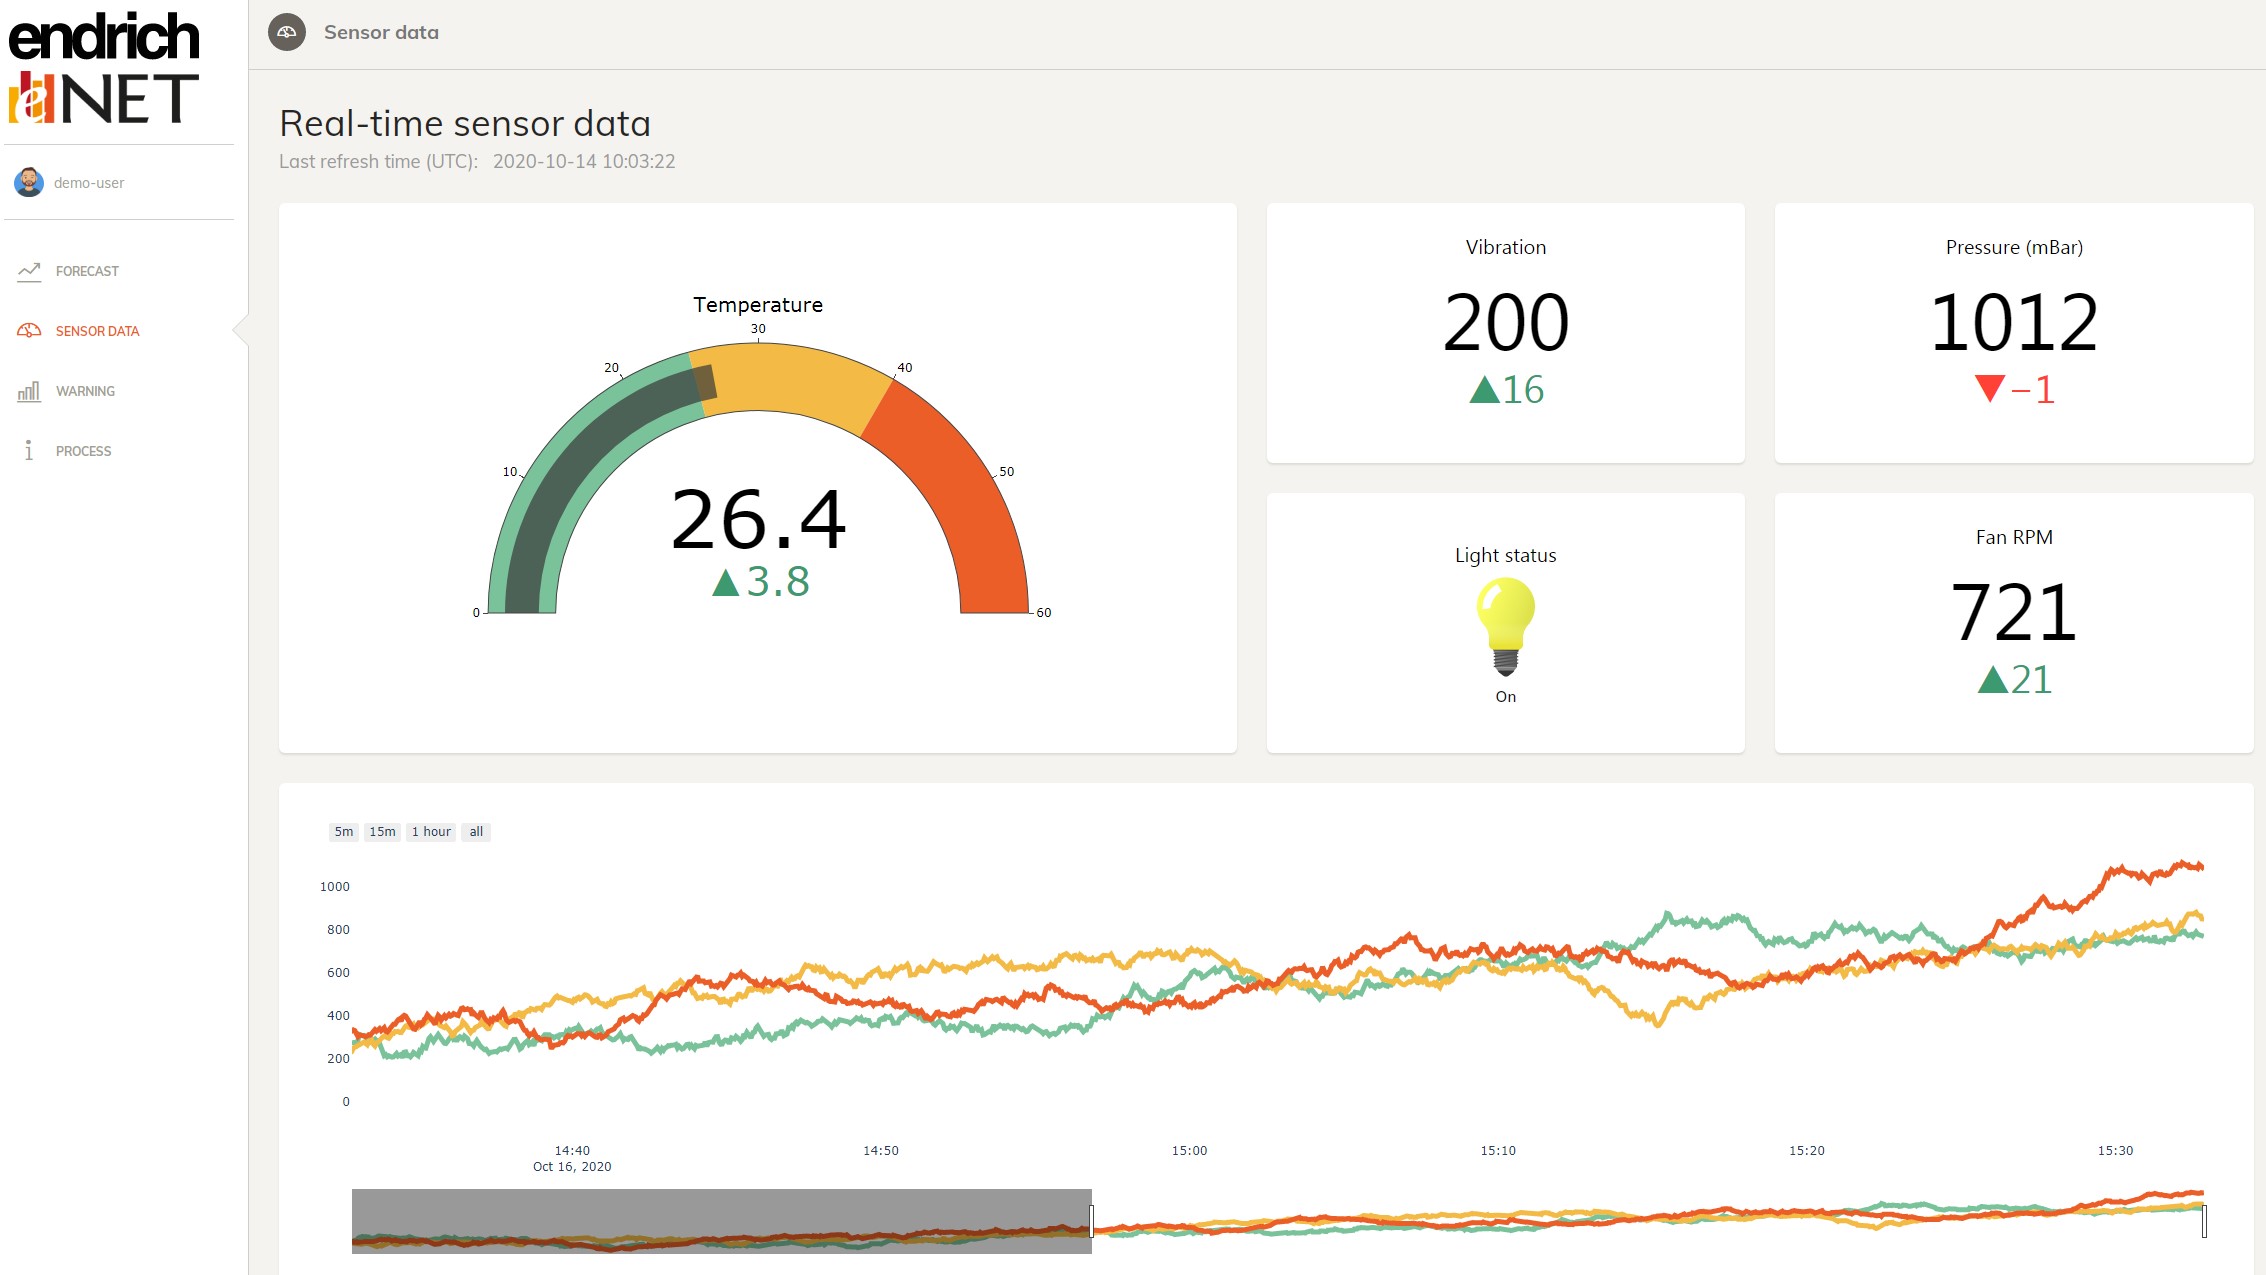
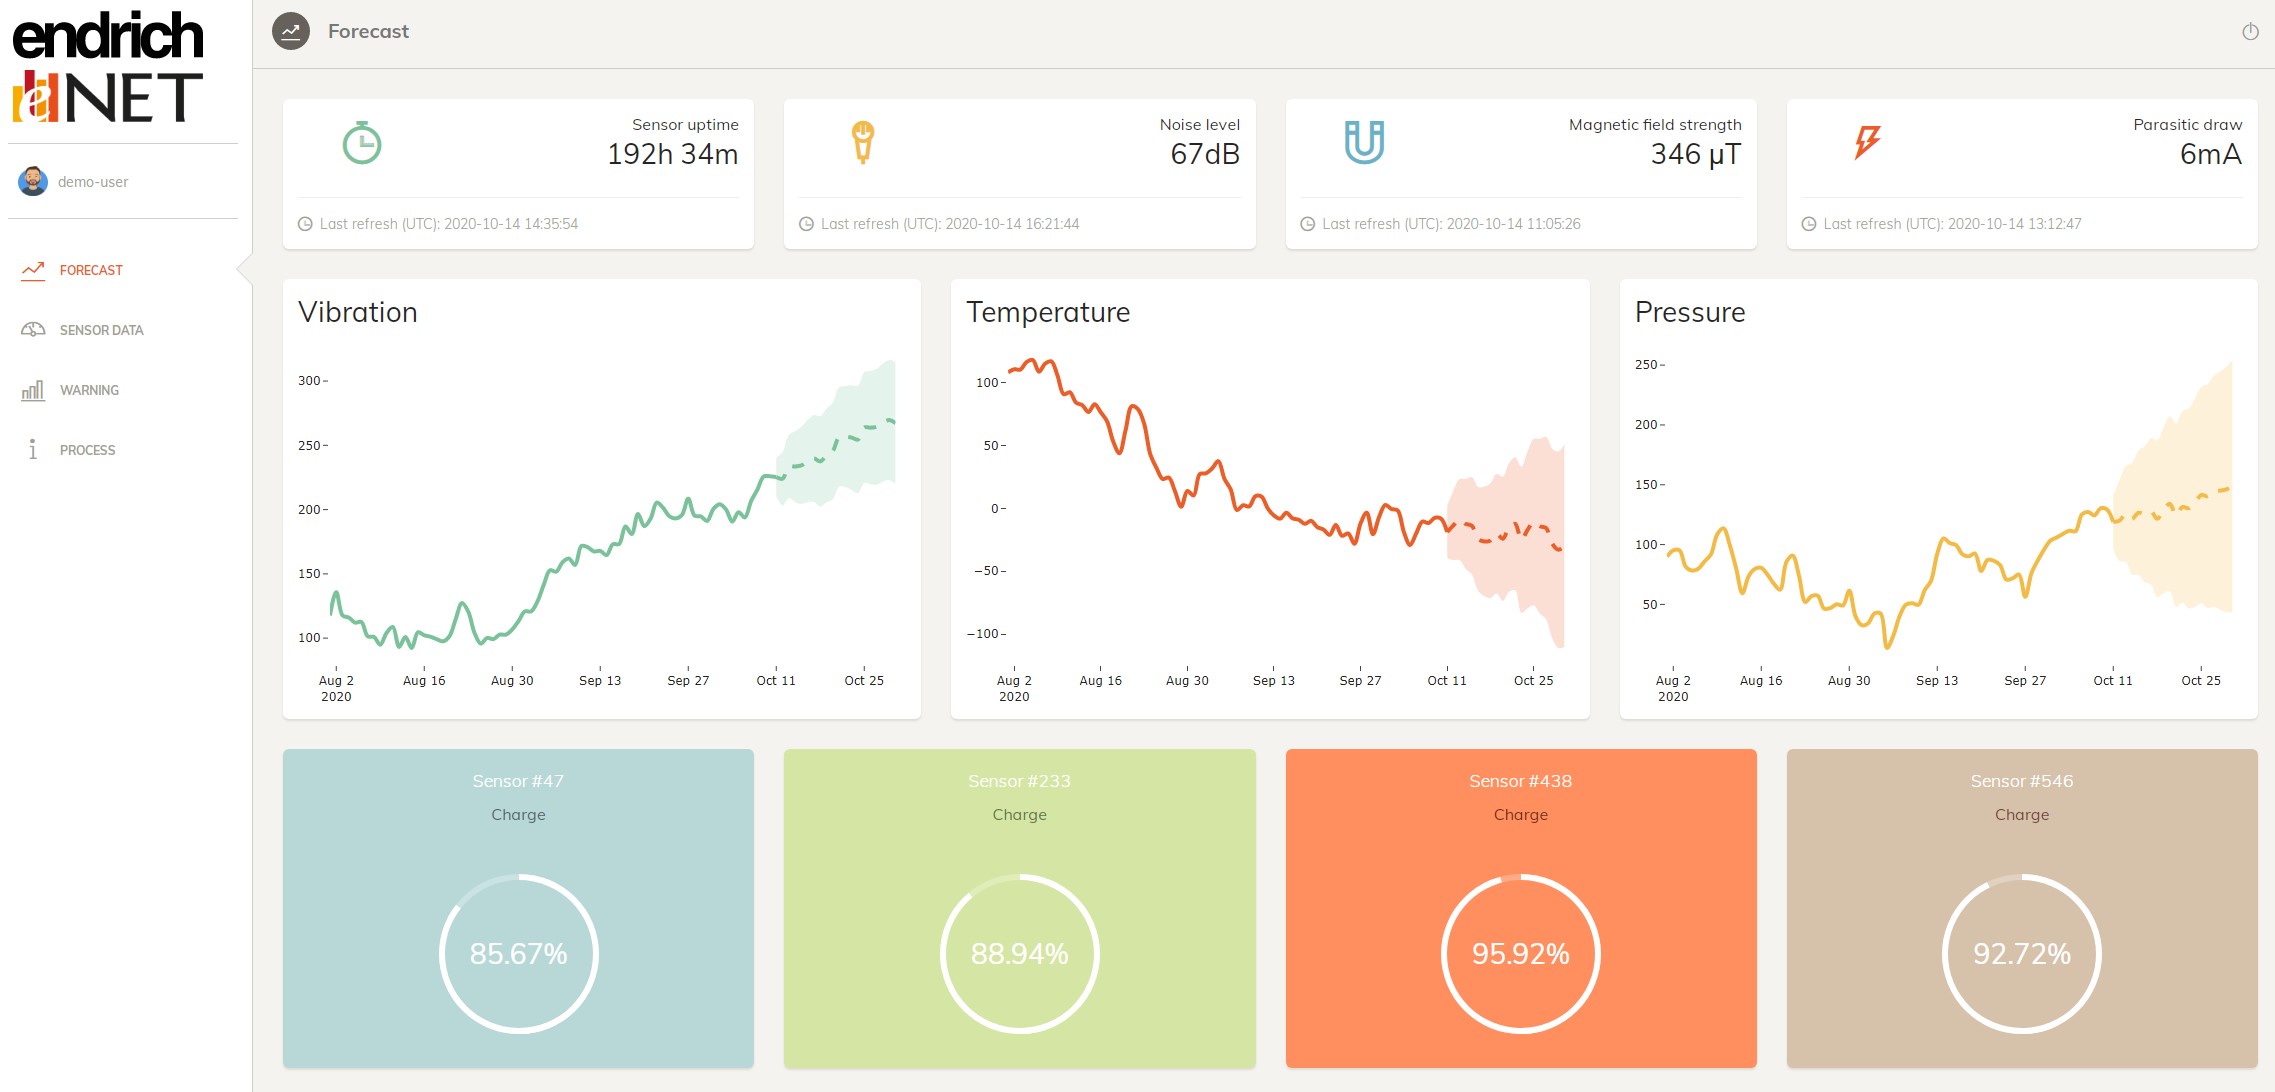
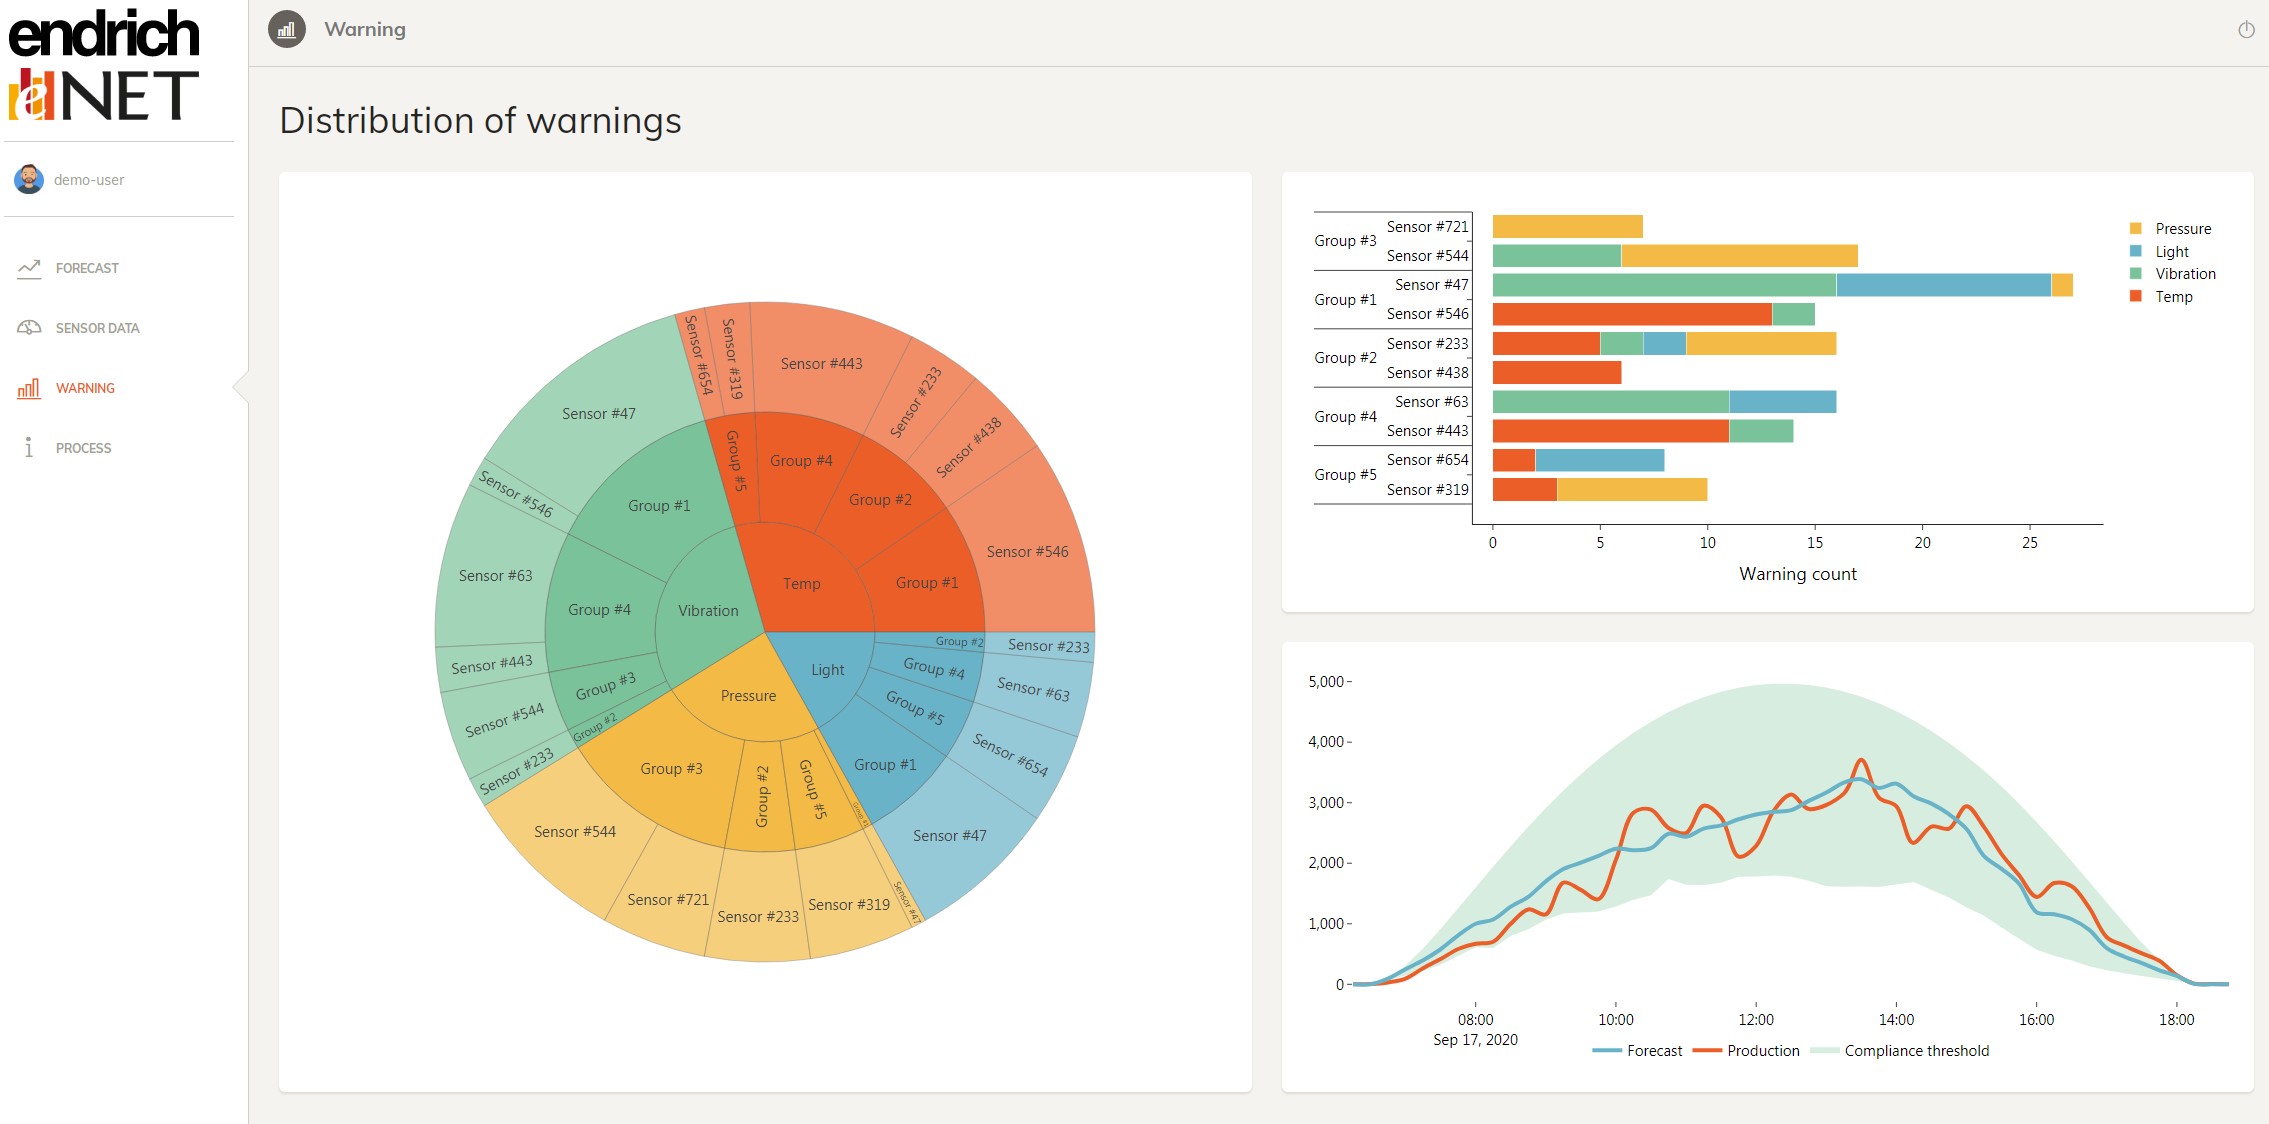
Another popular way of treating the collected data is to offer classic 2D dashboard software. These - usually graphics engines - not only visualize data, but also analyze them and coffer extended services such as watching data being within preset limits, making extrapolations, predict future values thus offer help for instance in predictive maintenance or raising early warnings. Some of the examples can be seen on the following screenshots :
Should you need such individual services from us, please contact to your sales representative.